An analysis of customer purchasing behaviour of an online retail company. It is a transactional dataset from a UK-based online retailer from December 2010 to December 2011. The aim is to analyse the sales patterns and propose marketing or strategy to improve sales or customer retention.
Data pre-processing
The data was checked for null values. The duplicate transactions were identified and removed. For the given data, the input variables are invoice no, stock code, stock description, quantity, invoice date, unit price, customer code and country. It was observed there are multiple transactions with the same invoice no. or same invoice date, unit price, customer code, stock code, quantity and country. There can be more than one transaction with the combinations of same invoice no and customer code or customer code and quantity or invoice no and unit price. But each invoice no has a unique stock code, as there cannot be multiple orders of the same product in one invoice. Hence, the transactions with duplicate entries of both stock code and invoice no were identified and removed. The transactions with invalid values (like 0 or negative) in quantitative variables like unit price and quantity were also removed. The missing customer IDs were labelled as ‘guest’.
Feature Engineering
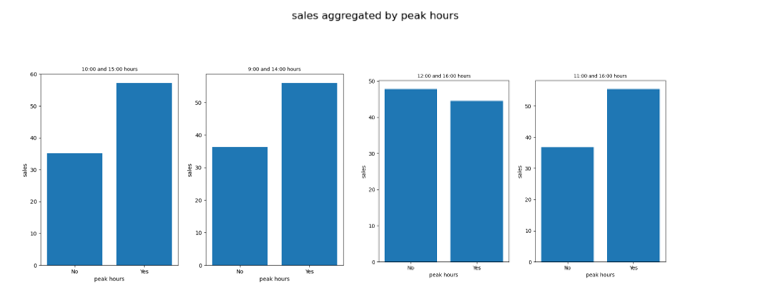
The total product price of a transaction was calculated by multiplying unit price by quantity and assigning to a new column ‘total price’. Year, month and day of week were extracted from each transaction date and assigned to new columns ‘Year’, ‘Month’ and ‘Day of week’. A binary feature called ‘Peak hours’ was created for the transactions that occur during peak hours (assumed between 9 am and 6 pm).
Exploratory data analysis
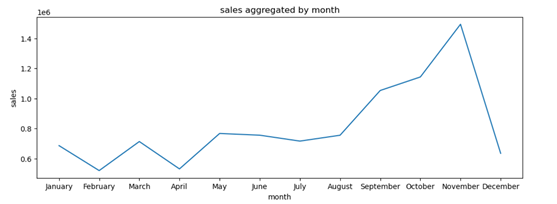
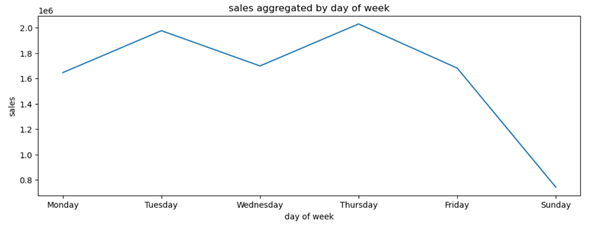
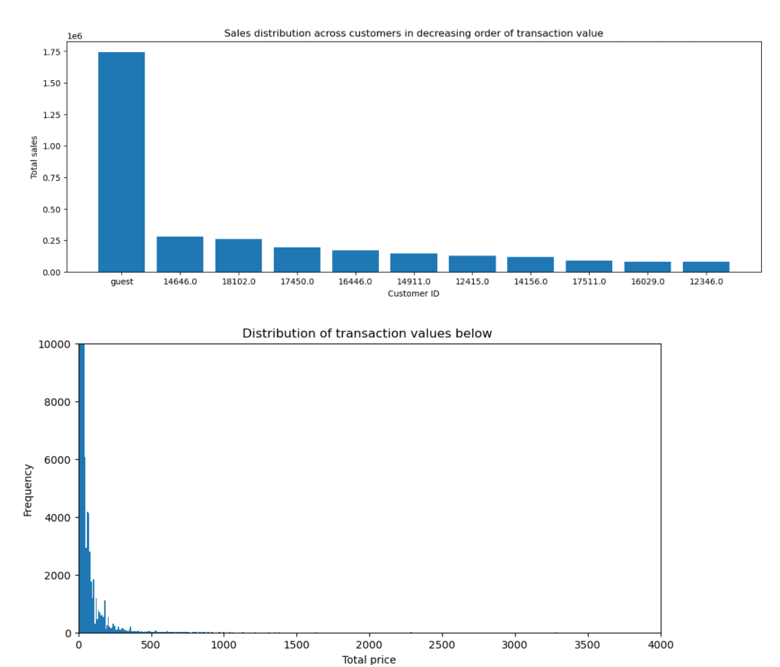
The sales pattern was analysed by aggregating sales by month and day of week. The sales aggregate was also observed for the peak hours. The most valuable customers were identified by arranging the total sales for each customer code in decreasing order of transaction values.
Data visualisations
Observations and Insights
The distribution of transaction values is heavily skewed towards left, indicating that the frequency of sales value is the highest in the range 0 to 50. The values are as low as 0.001 and as high as 80000. But the frequency of occurrence of extremely high values is the lowest and extremely low values is much higher. The new customers identified as ‘guest’ contribute the highest to the aggregate transaction value/total sales. The top 10 customers in terms of transaction value had the following customer IDs ‘14646’, ‘18102’, ‘17450’, ‘16446’, ‘14911.0’, ‘12415’, ‘14156’, ‘17511’, ‘16029’, ‘12346′.
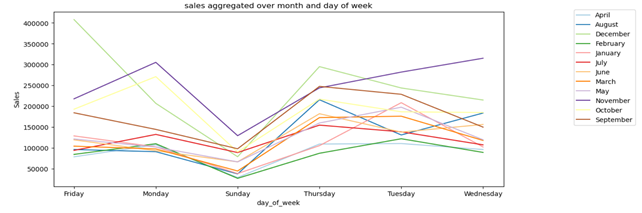
The sales distribution shows monthly fluctuations between December and July. The sales slowly improve after July and surge after August. Sales peak in November followed by lean season that begins in December. The transactions are the lowest in February and April. The aggregate transaction value by day of the week shows peak sales on Thursday and Monday for most of the months of the year 2011. The aggregate transaction by month and day of week shows that sales are always lowest on Sundays for nearly all the months. While sales the peak on Monday and Thursday or Tuesdays for most of the months, the month of December shows the highest sales on Fridays and November on Wednesdays.
The time of the sales is between 6:00 am and 8:00 pm. To find the peak hours, daily sales distribution was observed for different time slots. It is observed that more than 50% of transactions, in terms of aggregate sales value, occur between 9 am and 4 pm.
Recommendations
- Design marketing campaign to enhance sales during lean period, especially February and April.
- The marketing campaign should take into account the consumption pattern of the most valuable customers.
- Factors like time of shopping, day of shopping and type of stock purchased should be taken into account while designing the campaign.
- There should be more focus on enhancing sales of stock whose average transaction value is around 20.
- There can be special offers on specific days like Tuesdays and Thursdays to increase sales in lean months.